
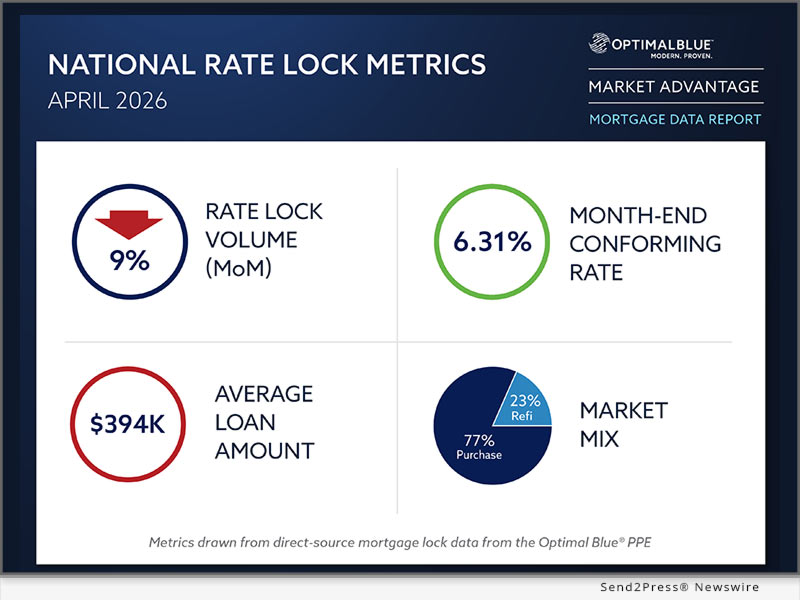
NATIONAL NEWS (PLANO, Texas) — — Optimal Blue today released its April 2026 Market Advantage mortgage data report, which found that mortgage lock activity pulled back after a strong first quarter. Total rate-lock volume declined 9% month over month (MoM) but remained 11% higher year over year (YoY). Purchase lock volume declined just under 2% from March but increased more than 9% from April 2025, continuing to lead production as refinance activity cooled.
Rate-and-term refinance volume fell nearly 38% MoM but remained more than 22% higher YoY, while cash-out refinance volume declined 12% MoM but was up 11% YoY. Refinance share slipped to 23% of total volume, down from March but still above year-ago levels.
Mortgage rates remained elevated throughout April but finished slightly lower by month-end. The Optimal Blue Mortgage Market Indices (OBMMI) 30-year conforming fixed rate, the benchmark for CME Group’s Mortgage Rate futures, ended the month at 6.31%, down 4 basis points (bps) MoM. The 10-year Treasury yield finished April at 4.40%, up 10 bps MoM, while the spread between the 10-year Treasury and the 30-year mortgage rate narrowed to 191 bps as mortgages outperformed.
“April looks more like a cooling from a strong first quarter than a real weakening in borrower demand,” said Mike Vough, senior vice president of corporate strategy at Optimal Blue. “Purchase activity held up well despite rate pressure, while refinance volume reacted more quickly to recent rate moves. That split reinforces how rate-sensitive borrowers remain, even as the spring purchase market continues to show resilience.”
On the secondary side, April data pointed to renewed movement toward agency mortgage-backed securities (MBS) execution. Agency MBS sales increased while bulk loan sales declined, and mortgage servicing rights (MSR) values rose as higher rates reduced expected refinance activity. Investor participation also increased after holding steady for three consecutive months.
“In a higher-rate environment, lenders are paying close attention to where execution value is showing up,” said Vough. “The move toward agency MBS execution, combined with higher MSR values and increased investor participation, continues to prove that lenders need to evaluate all potential execution options to maximize profitability.”
Key findings from the Market Advantage report, derived from direct-source mortgage lock and secondary market data, include:
Volume trends and market composition
* Refi activity cools: Rate-and-term refinance volume fell nearly 38% MoM but remained more than 22% higher YoY, while cash-out refinance volume declined 12% MoM but rose 11% YoY. Refinance share slipped to 23% of total volume.
* Purchase activity holds steady: Purchase lock volume declined just under 2% MoM but increased more than 9% YoY, continuing to lead overall production.
* Conforming share drops below 50%: Conforming share fell just below 50% of total lock volume in April for the first time since Optimal Blue began tracking this metric. FHA share rose to 19%, VA increased to 13%, non-conforming declined to 17% and USDA held steady at 1%.
* Non-QM share remains elevated: Non-qualified mortgages accounted for 9% of total lock volume in April, up 30 bps MoM and 233 bps YoY, with investor and bank-statement products leading expanded-guideline activity.
* ARM levels remain elevated: Adjustable-rate mortgages accounted for 10% of total production, down 182 bps MoM but broadly in line with year-ago levels and well above pre-2022 norms.
* Property mix shifts: Single-family homes represented 64% of production, while planned unit developments, a proxy for new construction activity, declined to 28%, down 42 bps MoM and 326 bps YoY. Condo share also declined to 6%.
Rates and pricing
* Mortgage rates outperform Treasuries: The OBMMI 30-year conforming fixed rate finished at 6.31%, down 4 bps MoM. Jumbo rates ended at 6.43%, VA rates at 5.90% and FHA rates at 6.06%. The 10-year Treasury increased 10 bps to 4.40%, while the mortgage-to-Treasury spread narrowed to 191 bps.
* MSR values climb: MSRs rose 5 bps to 1.29%, representing a 5.16 multiple, moving in line with higher rates and lower refinance expectations.
* Conventional spreads widen: Best-efforts-to-mandatory spreads increased 4 bps for conventional 30- and 15-year products, while government 30-year spreads decreased 3 bps.
* Lower-tier sales increase: Loans sold to the fourth or lower price tier increased 89 bps to 5%, while third-tier share increased 21 bps.
Channel and execution
* Agency MBS share increases: Hedged loan sales to agency MBS rose 354 bps to 44%, marking a shift toward securitization executions.
* Bulk executions decline: Bulk loan sales decreased 257 bps to 25%.
* Investor count rises: Investor participation increased to 15 in April after holding at 14 for the prior three months.
Product mix and borrower profiles
* First-time buyers maintain purchase presence: First-time homebuyer share remained nearly flat in April but continued to represent a meaningful share of purchase activity, accounting for 47% of conforming purchase locks, 70% of FHA purchase locks and 45% of VA purchase locks.
* DTI ratios remain stable: Purchase debt-to-income ratios improved YoY, with conforming at 36.2%, FHA at 43.5% and VA at 42.7%.
* Credit quality holds firm: The average purchase credit score held at 735, unchanged from March. By product, conforming borrowers averaged 753, FHA borrowers averaged 676 and VA borrowers averaged 716.
* Pull-through rates improve: Purchase pull-through rose to just over 82%, up 208 bps MoM but down 58 bps YoY. Refinance pull-through increased to just under 79%, up 356 bps MoM and 1,381 bps YoY.
* Loan amounts decline: The average loan amount was $394,046, down from $401,100 in March and $404,586 in February. The average loan-to-value ratio (LTV) was 81.64%. Loan amounts ranged from $888,871 in greater San Francisco to $302,493 in Cincinnati, while regional LTVs ranged from 71.23% in the Bay Area to 89.05% in San Antonio.
To view the full April 2026 Market Advantage report, complete the free subscription form: https://engage.optimalblue.com/market-advantage.
Subscribers receive a report PDF each month with the latest data. Members of the press are eligible for special, advance access each month and should contact Alexandra Kreuter to be added to the media list.
About the Market Advantage Report
Optimal Blue issues the Market Advantage mortgage report each month to provide insight into U.S. mortgage trends and drivers of lending profitability. Data is sourced from the Optimal Blue PPE, which is used to price and lock more than one-third of all mortgages nationwide, and Optimal Blue’s hedging and loan trading system, which supports approximately 40% of loans hedged and sold into the secondary market. As the leader in mortgage capital markets technology, Optimal Blue has a direct view of both origination and secondary market activity and the interconnectedness of the two. Unlike self-reported survey data, Optimal Blue’s direct-source data accurately reflect the in-process loans in lenders’ pipelines and secondary market executions. Visit Optimal Blue’s website to subscribe to receive the free report each month.
Nothing herein shall be construed as, nor is Optimal Blue providing, any legal, trading, hedging or financial advice.
About Optimal Blue
Optimal Blue powers profitability across the mortgage capital markets ecosystem. As the industry’s only end-to-end capital markets platform, our technology, data and integrations bridge the primary and secondary markets to help lenders of all sizes maximize performance – from pricing accuracy to margin protection and every step in between. Backed by over 20 years of proven expertise, our modern, cloud-native technology delivers the real-time automation, actionable data and seamless connectivity lenders need to navigate market volatility and scale for growth. To learn more about how Optimal Blue delivers measurable ROI, visit https://OptimalBlue.com.
This version of news story was published on and is Copr. © 2026 Massachusetts Newswire™ (MassachusettsNewswire.com)


